Enterprise analytics solutions bring data from systems such as ERP, CRM and operations into one trusted place, model it into consistent business metrics, and deliver it through dashboards, reports and AI. A complete solution has seven layers, from data sources to governance. Most companies buy the platform pieces and build only the parts specific to their business.
This guide is for CTOs, CFOs, operations leaders and data leads. It explains what an enterprise data analytics solution includes, why projects stall, and how warehouses, lakes and lakehouses compare. It also covers buying versus building, AI-ready data, a real example, a seven-step build plan, cost drivers and how to choose a partner.
Last updated: November 2026
Key takeaways
- A complete enterprise analytics solution has seven layers: sources, ingestion, storage, modeling, reporting, AI and governance.
- ERP, CRM and operations data are usually the most valuable sources, and the hardest to combine.
- Define each metric once in a semantic layer to end "two versions of the truth".
- Buy the platform pieces; build the data model, integrations and AI that are specific to your business.
- AI assistants and agents are only as reliable as the data underneath them.
- Start with one department, prove value, then expand.
What are enterprise analytics solutions?
Enterprise analytics solutions are the combination of data pipelines, storage, data models, reporting tools, AI and governance that let a whole organization measure and improve its performance from one trusted source of data. Unlike a single reporting tool, they connect data from many systems and serve many teams with consistent numbers.
Enterprise data and analytics work usually covers three kinds of questions:
- Descriptive: what happened? For example, last quarter's margin by product line.
- Predictive: what's likely to happen? For example, which orders will ship late.
- Prescriptive: what should we do? For example, which suppliers to prioritize when stock runs low.
The word "enterprise" matters. It means the solution has to handle data from many systems, serve many departments with different questions, and stay secure and accurate as the business grows.
Why do enterprise analytics projects stall?
Enterprise analytics projects usually stall because data from different systems doesn't agree, teams define the same metric differently, the project tries to serve every department at once, or dashboards are built before anyone agrees what decisions they should support. The technology is rarely the main problem.
Bad data is expensive as well as frustrating. Gartner estimates that poor data quality costs organizations an average of $12.9 million a year, a figure from its 2020 research. Your own cost will differ, but the pattern holds: data problems are usually found late, when they're most expensive to fix.
The most common causes:
- Two versions of the truth. Finance and sales report different revenue because their systems count it differently.
- Starting with tools, not decisions. A new platform is bought before anyone lists the decisions it should support.
- Everything at once. A company-wide program tries to model every department before delivering anything useful.
- Data quality left for later. Duplicates, missing fields and inconsistent codes surface only after dashboards go live, and trust collapses.
- No owner. Nobody is accountable for each key metric's definition.
- Spreadsheet habits. People keep exporting data to spreadsheets because the new reports don't answer their actual questions.
Each of these can be avoided with scope, ownership and a layer-by-layer plan.
What does an enterprise data analytics solution include?
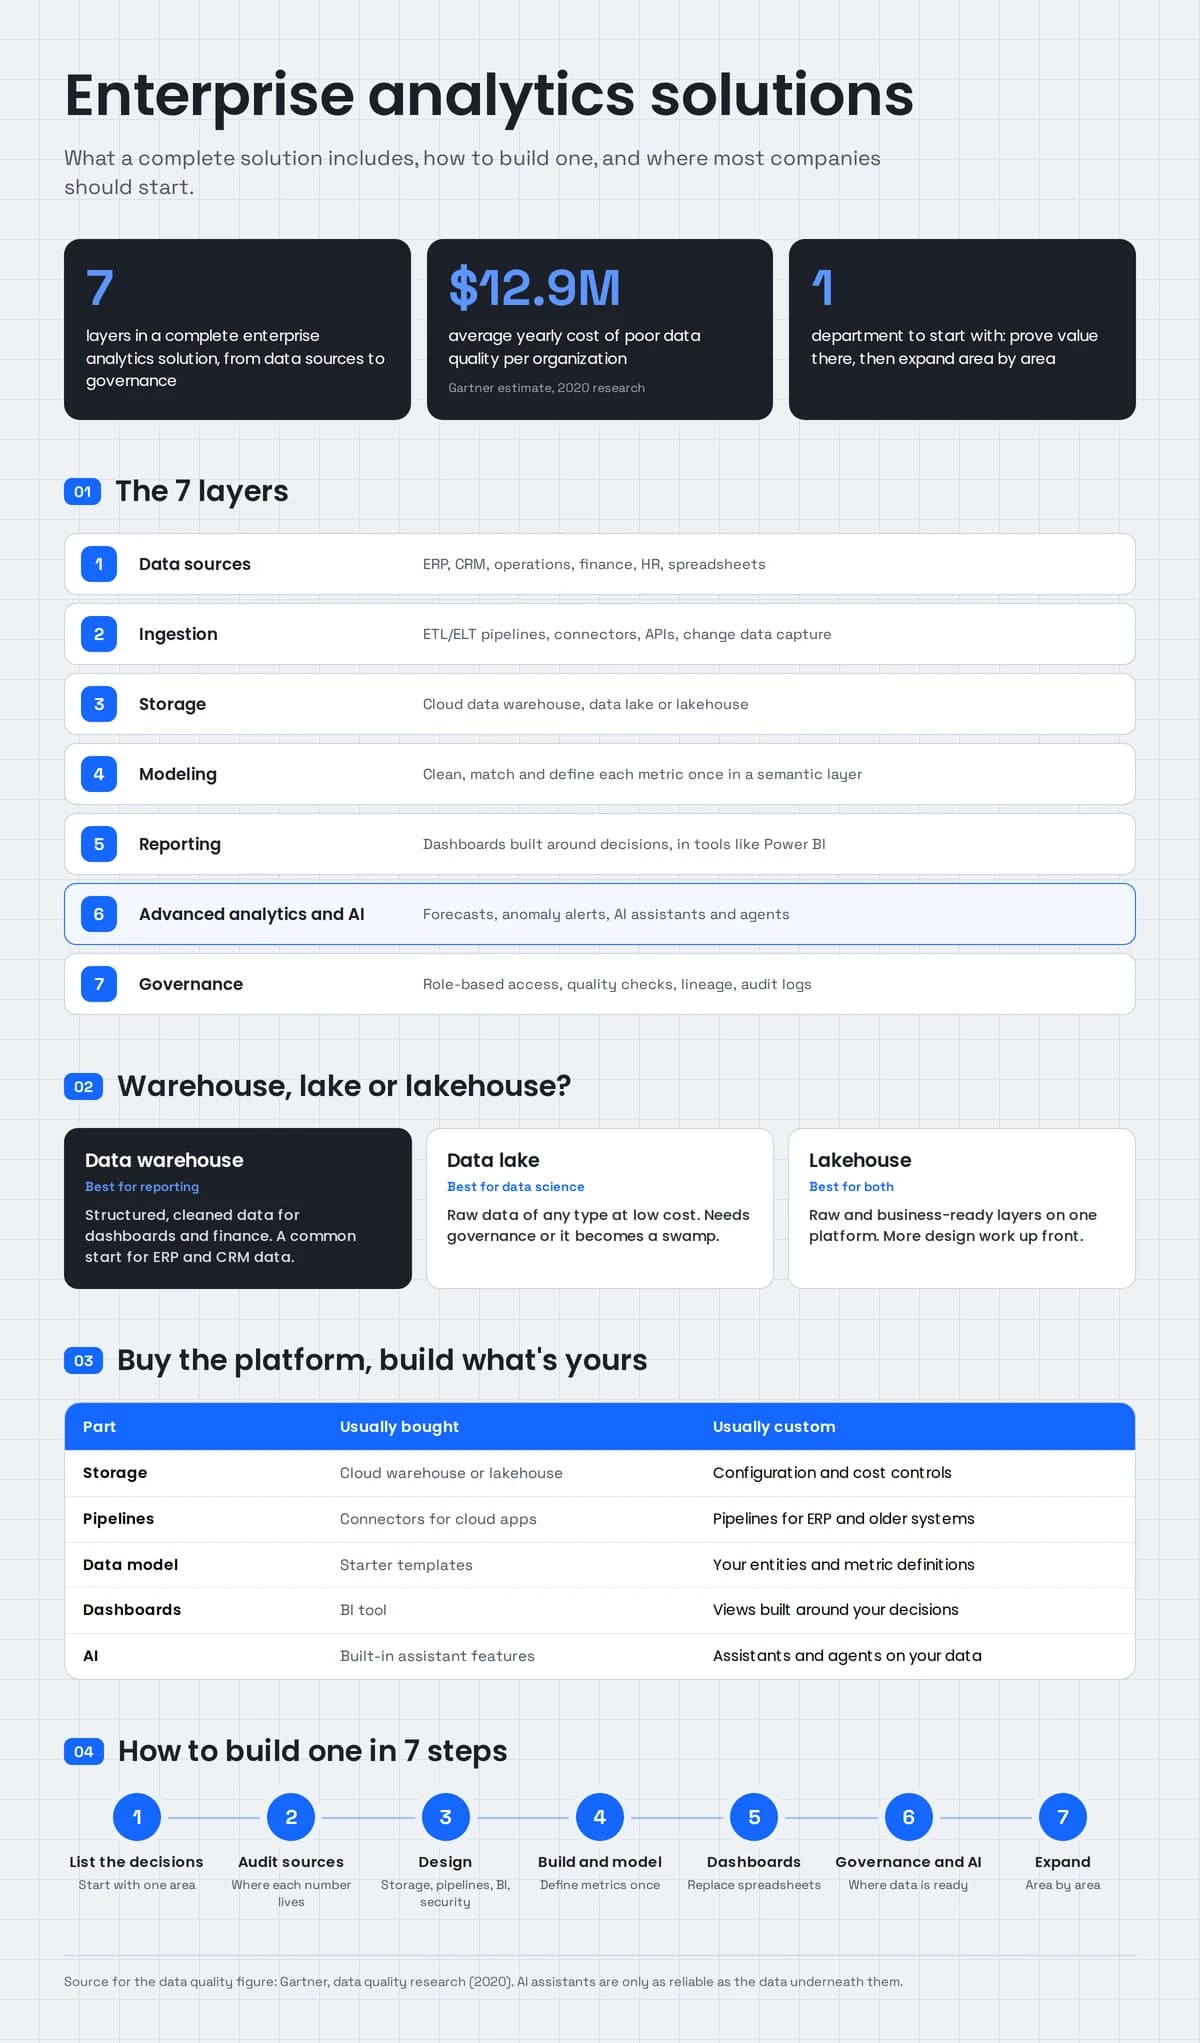
An enterprise data analytics solution includes seven layers. Source systems create the data, ingestion moves it, and storage holds it. Modeling turns it into consistent business metrics, and reporting presents it. Advanced analytics and AI predict and assist, while governance keeps everything secure, accurate and compliant.
| Layer | What it does | Common tools and approaches |
|---|---|---|
| 1. Data sources | Systems that create the data | ERP, CRM, operations, finance, HR, spreadsheets, IoT |
| 2. Ingestion and integration | Moves and syncs data | ETL/ELT pipelines, connectors, APIs, change data capture |
| 3. Storage | Holds data for analysis | Data warehouse, data lake or lakehouse in the cloud |
| 4. Modeling | Cleans data and defines metrics once | Layered models, semantic layer |
| 5. Reporting | Presents insights | Dashboards and reports in tools such as Power BI or Tableau |
| 6. Advanced analytics and AI | Forecasts, flags and answers questions | Machine learning, AI assistants, AI agents |
| 7. Governance | Controls access, quality and compliance | Roles, data catalog, lineage, quality checks, audit logs |
1. Data sources: ERP, CRM and operations
Most useful enterprise analytics starts with operational data, not web traffic. Your ERP holds orders, inventory, purchasing, production and finance. Your CRM holds pipeline and customer history. Operations, HR and support systems, plus the spreadsheets people still rely on, fill in the rest.
ERP data is usually the richest and the hardest to use directly. ERP systems are designed to record transactions, not to answer cross-functional questions, and their table structures are complex. Getting ERP and CRM data into one model is where most of the value sits. If your systems themselves need work, our ERP and CRM team builds and integrates them.
2. Ingestion and integration
Ingestion moves data from source systems into your analytics storage. The main patterns are:
- Batch loads on a schedule, such as every night or every hour.
- ELT or ETL pipelines that extract data and transform it either before or after loading.
- Change data capture (CDC), which copies only the records that changed, for near-real-time updates.
- APIs and connectors for cloud applications.
Match freshness to the decision. Finance reporting can usually run daily; stock-outs and service queues may need data within minutes. Faster pipelines cost more to run, so don't make everything real-time by default.
3. Storage: warehouse, lake or lakehouse
Storage is where data lives for analysis. A data warehouse stores structured, cleaned data for reporting. A data lake stores raw data of any type. A lakehouse combines both. Cloud platforms such as Microsoft Fabric, Snowflake, Databricks, Google BigQuery and Amazon Redshift all offer versions of these. The comparison table below explains which fits which need.
4. Modeling and the semantic layer
Modeling is where raw data becomes trustworthy business data. A common approach uses three stages: raw data as it arrived, cleaned and matched data, and business-ready tables built around how the company thinks (orders, customers, products, plants).
The semantic layer sits on top. It defines each metric once, such as "net revenue" or "on-time delivery", so every dashboard, report and AI assistant uses the same definition. This is the single most effective fix for the "two versions of the truth" problem.
5. Dashboards and reporting
Dashboards should be built around decisions, not around data. For each dashboard, write down who uses it, which decision it supports and how often. A plant manager's daily view looks nothing like a CFO's monthly view, and trying to serve both on one page usually serves neither.
Keep a small number of trusted, certified dashboards, and let analysts explore beyond them in a governed way.
6. Advanced analytics and AI
Once the data is reliable, it can do more than describe the past:
- Forecasting demand, cash flow or maintenance needs.
- Anomaly detection for unusual costs, quality issues or fraud.
- Natural-language questions, where staff ask "which customers are behind on payments this month?" and get an answer from approved data.
- AI agents that pull figures, write recurring analysis and flag exceptions for people to review.
AI makes the earlier layers more important, not less. An AI assistant on top of inconsistent data simply gives inconsistent answers faster.
7. Governance, security and quality
Governance keeps the solution trustworthy as it grows:
- Role-based access so each person sees only the data they're allowed to.
- Data quality checks that catch missing or unusual values before they reach reports.
- Lineage that shows where each number came from.
- A data catalog that explains what each table and metric means.
- Audit logs and compliance controls for regulated data such as health, financial or personal information
Data warehouse vs data lake vs lakehouse: which do you need?
A data warehouse stores cleaned, structured data and is best for reliable reporting on ERP, CRM and finance data. A data lake stores raw data of any kind cheaply and suits data science on large or unstructured data. A lakehouse combines the two in one platform. Most mid-sized companies start with a warehouse or a lakehouse.
| Data warehouse | Data lake | Lakehouse | |
|---|---|---|---|
| Data stored | Structured, cleaned | Raw, any format | Both, in layers |
| Best for | Reporting, dashboards, finance | Data science, logs, documents, sensor data | Reporting and data science on one platform |
| Data quality | High, enforced on load | Varies; needs care | High in the business-ready layers |
| Typical users | Business analysts, managers | Data scientists, engineers | Both |
| Main risk | Rigid if needs change fast | Becomes a "data swamp" without governance | More design work up front |
When people search for the best enterprise analytics solutions for data warehousing, the honest answer is that the platform matters less than the model on top of it. A well-designed warehouse on any major cloud platform will outperform a poorly modeled one on the most expensive platform.
Should you buy a platform, build custom or combine both?
Buy proven platforms for storage, pipelines and dashboards, because building those yourself rarely pays off. Build custom where your business is unique: data models, metric definitions, integrations with older systems, industry-specific analytics and AI assistants. Most companies end up with this combination.
| Part of the solution | Usually bought | Usually custom |
|---|---|---|
| Storage and compute | Cloud warehouse or lakehouse | Configuration and cost controls |
| Pipelines | Connectors for common cloud apps | Pipelines for ERP, legacy and in-house systems |
| Data model | Starter templates | Your business entities and metric definitions |
| Dashboards | BI tool | Dashboards built around your decisions |
| AI | Built-in assistant features | Assistants and agents grounded in your data and rules |
| Governance | Platform security features | Roles, quality rules and documentation for your organization |
Packaged "enterprise analytics platforms" with prebuilt content can speed things up when your processes are standard. The more your operations differ from the template, the more the custom model matters.
What does AI-ready data mean?
AI-ready data is data that's accurate, consistently defined, documented, connected across systems and protected by access rules, so AI assistants and agents can use it safely. If people don't trust a number in a dashboard, an AI system built on the same data won't be trusted either.
Your data is AI-ready when:
- Key metrics are defined once in a semantic layer and used everywhere.
- Tables and fields are documented, so an AI system can tell what "status = 4" means.
- Access rules are enforced in the data platform, so an assistant only sees what the person asking is allowed to see.
- Quality is monitored, so bad data is caught before an AI uses it.
- Documents are organized and current, for assistants that answer from policies, procedures or contracts.
This is also why many AI projects begin as data projects. Our AI integration services connect models and agents to warehouses and business systems once these foundations are in place.
Real example: AI agents running on an enterprise data warehouse
The Manufacturing Agent Platform shows what an enterprise data foundation makes possible. A precision manufacturer with no in-house AI team now has department assistants for nine teams, built from ninety narrowly scoped agents, all connected to the company's enterprise data warehouse and Microsoft 365 with role-based access.
The problem: sales, production, quality, maintenance, logistics, finance, purchasing, planning and people teams each spent hours every week on the same recurring work, and knowledge about how to do it lived with a few people.
What we built: the Manufacturing Agent Platform gives each department its own assistant. Each one is made up of narrowly scoped AI agents that handle a single recurring task using data from the warehouse.
What made it work: access is matched to each department's data, each agent was validated against real scenarios by the staff who use it, and the client's own team maintains the platform after handover. It was built with Claude Code, a multi-agent architecture, Model Context Protocol (MCP) and AWS.
The lesson for analytics buyers: the warehouse was the foundation. Because data from across the business already sat in one governed place, the agents could be scoped by department and trusted by the people who use them.
How to build an enterprise data analytics solution in 7 steps
To build an enterprise data analytics solution, start from the decisions you want to improve and audit the data behind them. Then design the architecture and build pipelines and models for one area. Deliver dashboards people actually use, add governance and AI, and expand area by area.
- List the decisions. Write down the ten decisions leaders make most often and the numbers each needs. Start with one area, such as finance or operations.
- Audit the sources. Map where each number comes from (ERP, CRM, spreadsheets) and how reliable it is.
- Design the architecture. Choose storage, pipeline approach, modeling layers, BI tool and security model, based on your existing cloud and skills.
- Build the first pipelines and model. Load the sources for the first area, clean them, and define its metrics once in the semantic layer.
- Deliver dashboards people use. Build two or three dashboards with the people who make the decisions, and retire the spreadsheets they replace.
- Add governance and AI. Set roles, quality checks and documentation; then add forecasting or AI assistants where the data is ready.
- Expand area by area. Reuse the same platform and patterns for the next department.
This is the approach our data and analytics team takes: one area live and trusted before the next begins. For the cloud side, our cloud and DevOps team handles infrastructure, security and cost controls.
Want to know where your data stands? Book a 30-minute call with our CTO and we'll review your sources, reporting and AI plans, and suggest the first area to start with.
How much do enterprise analytics solutions cost?
Enterprise analytics solution costs depend on the number and complexity of data sources, data quality, freshness requirements, the number of departments and users, AI features, compliance needs and platform licensing. A first area with a few sources costs far less than a company-wide program. Plan for build costs and for ongoing platform, storage and support costs.
| Cost driver | Lower cost | Higher cost |
|---|---|---|
| Sources | A few modern cloud apps | ERP plus older on-premise systems |
| Data quality | Mostly clean | Duplicates and inconsistent codes |
| Freshness | Daily | Near real time |
| Scope | One department | Company-wide |
| Users | A small analyst group | Hundreds of report users |
| AI | None at first | Forecasting, assistants and agents |
| Compliance | Internal data | Regulated personal, health or financial data |
Platform costs scale with storage, compute and users, so design pipelines and models to avoid processing data more often than decisions need. A phased approach also spreads the investment and proves value before the next phase is funded.
How do you choose an enterprise analytics company?
Choose an enterprise analytics company that starts with your decisions, not a tool, and can work with your ERP and older systems. Good enterprise analytics services also build in governance and data quality from the start, deliver in phases, extend into AI, and hand over documentation and ownership. The same tests apply whether you need analytics for enterprise-wide reporting or for one department.
Use this checklist when comparing big data and enterprise analytics providers:
- Do they ask which decisions you want to improve before recommending a platform?
- Have they worked with ERP data and older on-premise systems?
- Can they explain their modeling approach and how metrics are defined once?
- Do they build data quality checks and role-based access from the start?
- Will they deliver one area first, then expand?
- Can they add AI assistants or agents once the data is ready?
- Do you own the code, models, documentation and cloud accounts?
- Will your team be able to maintain it after handover?
You can see how we approach this in our enterprise data analytics services.
Start with the decision your team makes most often
You don't need a company-wide data program to start. Pick the decision your leaders make most often, find the data behind it, and build one trusted view around it. Everything else can follow from there.
AllZone Technologies builds enterprise analytics solutions, from ERP and CRM pipelines and cloud warehouses to dashboards, AI assistants and agents. See our enterprise analytics work, or contact us to review your data and plan the first phase.